Spatial Discovery, the open source WebXR client spARcl improvement & Cesium Viewer
Spatial Discovery
We envision location-anchored, community-created digital media content, interactive visual navigation, restaurant discovery, lecture discovery, ride-hailing, etc., applications. This content can be as simple as text bubbles, Web URLs, directional arrows or labels, but also complex interactive experiences including 3D models and 3D sounds, all delivered in a Web App with contextual search.
We query heterogeneous data sources nearby via the OSCP spatial content discovery mechanism. The project also added multi-user scenarios, so new content created by one user shall be accessible to other users.
Open source WebXR Client spARcl Improvements
For demonstrations, we have previously developed a WebXR-based mobile client (named spARcl, spatial AR cloud client), which we also extended in the framework of this project.
Authentication
The application now supports secure authentication via Auth0, enabling users to sign in with their Google account using a popup-based OAuth2.0 flow. A NoAuth mode is also available to allow direct guest access to AR features without login.
This update enhances the user authentication and onboarding experience by improving identity handling, session persistence, and consistency of the user flow across login modes. We automatically extract the username from the authenticated email (before @), replacing dots with underscores.
Continuous search for content while on the move
We have extended the client to repeatedly check whether it is approaching the border of its current H3 cell (contents are always queried via the coarse location provided by an H3 cell ID, see https://h3geo.org/).
In such a case, it also downloads content from neighbouring cells.
GUI improvements
The Dashboard and onboarding UI have been redesigned to improve their usability, readability and aesthetic appeal. The enhancements include form restructuring, improved layout for service data, visually consistent input styling and a dedicated guest customising screen. Users can also choose their avatar colour for multiplayer sessions.
RabbitMQ message broker connections
The messaging infrastructure was upgraded by migrating to @stomp/stompjs v7.0.0 along with a complete refactoring of the RabbitMQ WebSocket client setup, resulting in more stable, modern and maintainable code. The client automatically reconnects upon failure.
GeoPose sharing
While the VPS returns a one-time GeoPose of a camera, the AR devices continuously estimate the local relative motion and calculate their global GeoPose from that. The user devices publish their GeoPose along with their avatar (name, colour), and they subscribe to each other’s updates.
Video contents
This feature adds support for embedded video content in AR scenes. Videos are rendered as interactive 3D boxes in the AR space, allowing users to view and toggle playback with a click. The new VIDEO type was introduced in the OSCP Spatial Content Records (SCRs), and our clients can now load these from the URL specified in the SCR.
IoT sensor discover and visualisation in AR
Our spARcl WebXR client can now discover and display geo-anchored IoT sensors that send numerical values to a RabbitMQ topic. We have implemented the sensor discovery via the OSCP spatial content discovery mechanism.
Each sensor has a spatial content descriptor (SCR) stored in the spatial content database, like any other AR object. However, the sensors have additional properties, the most important one being the RMQ topic on which the sensor is sending its data. One could also define different RMQ servers for groups of sensors, but we have not addressed this issue, as it would introduce unnecessary complications due to separate authentication for each server. So the AR client can dynamically discover the sensors in the neighbourhood.
Furthermore, the SCR can contain information on how the sensor should be represented. We have implemented two types of visualisation: text only and particle system (others can be easily added later). The text-only mode displays the latest sensor value as 3D text above the sensor’s GeoPose, while particle systems offer widely customisable animations that change in real-time based on the received sensor value. All the necessary parameters are stored in the “Content Definitions” part of OSCP Spatial Content Records and are listed below. All the particle parameters are optional and have a default value.
Cesium Viewer
In this project, an “external globe viewer” was also created, serving three purposes in parallel. It can showcase the OpenVPS camera pose estimates, display the pose of AR client devices from live streams from WebXR clients, and show the results of the Points of Interest collection service. It is a Cesium-based visualiser that uses Google Earth’s models for buildings, terrain and surface of the globe. The GUI of the Web application is shown in the figure below.
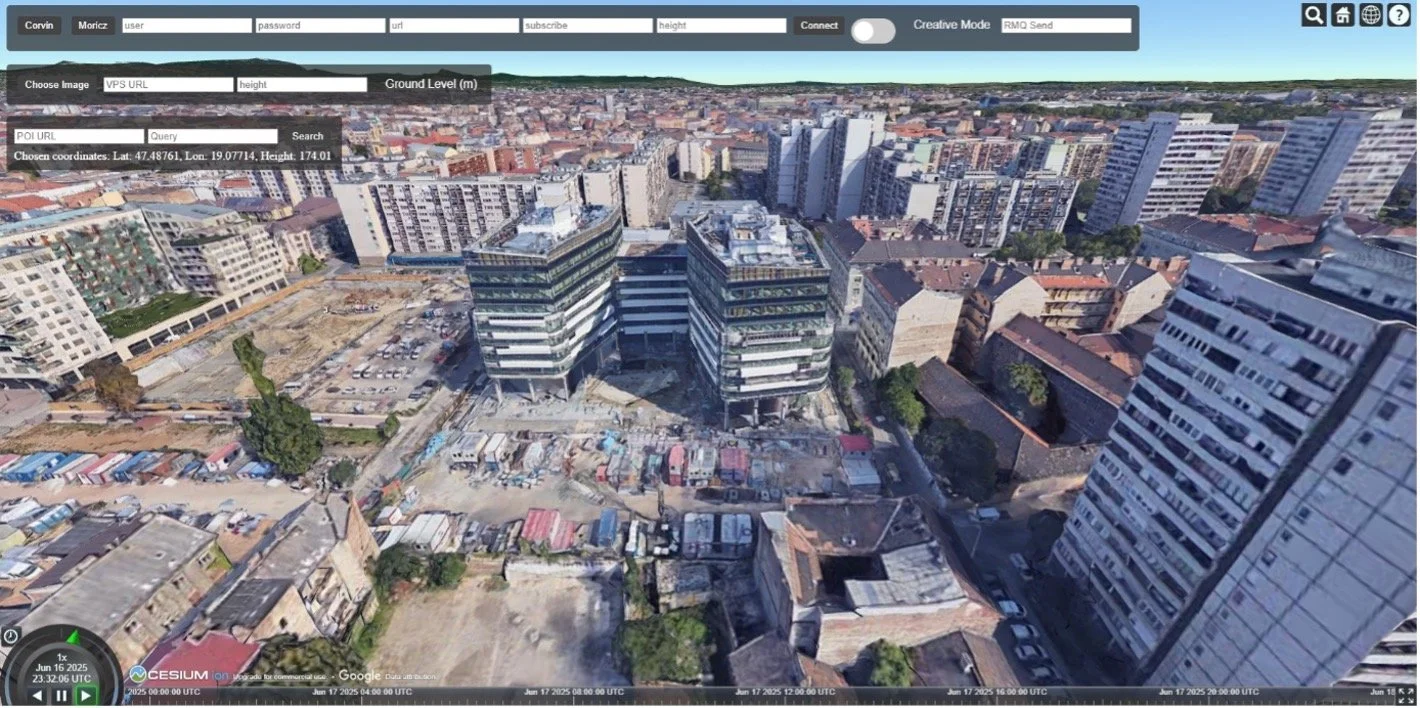
Globe view of OpenVPS results
In the globe viewer, we can test the OpenVPS results. Usually, the OpenVPS requires a photo, and it returns the position and the orientation where the photo was taken. In this example, we have to provide the URL where the service operates and then upload a photo. When the result is displayed, the viewer will enter a first-person view of the location where the picture was taken. We can add a „height” parameter, which indicates the ground level in meters. If we choose not to set the ground level, the viewer will automatically set itself to the ground.
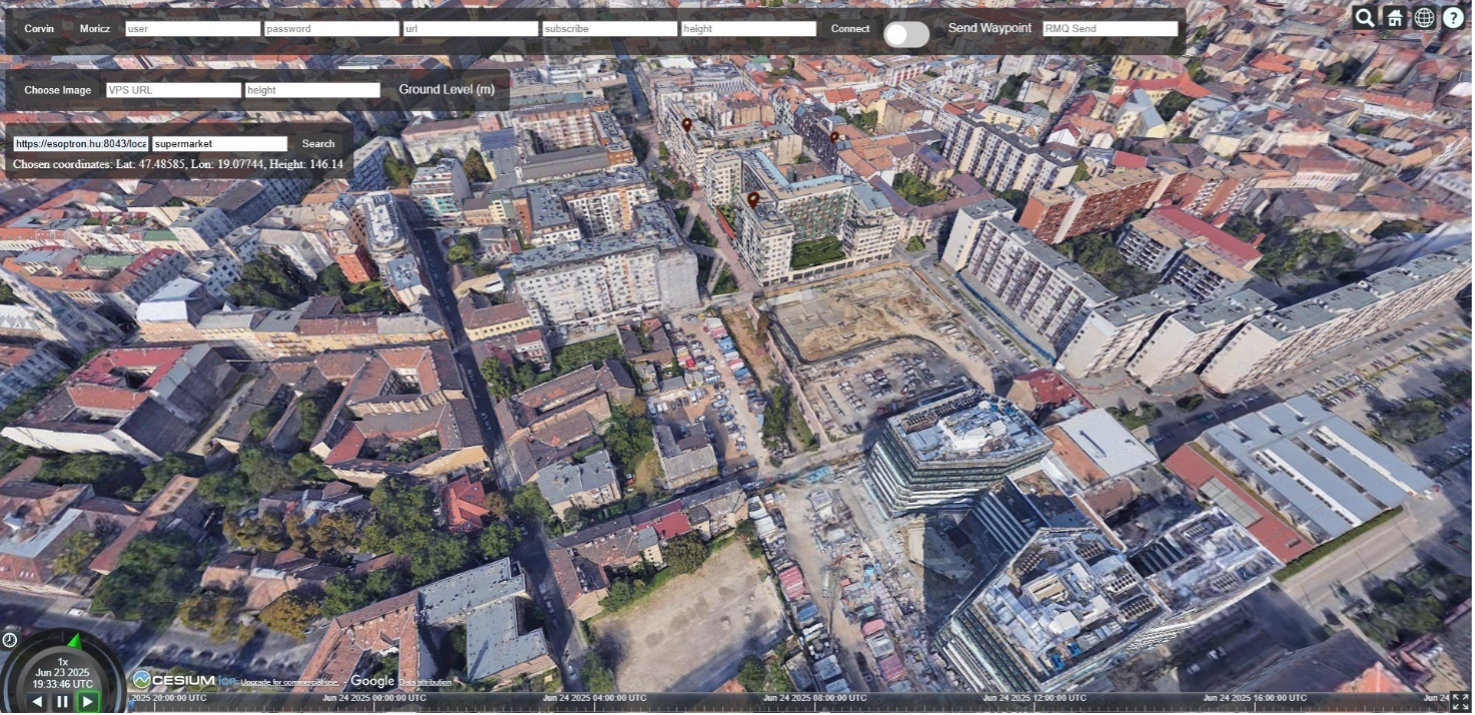
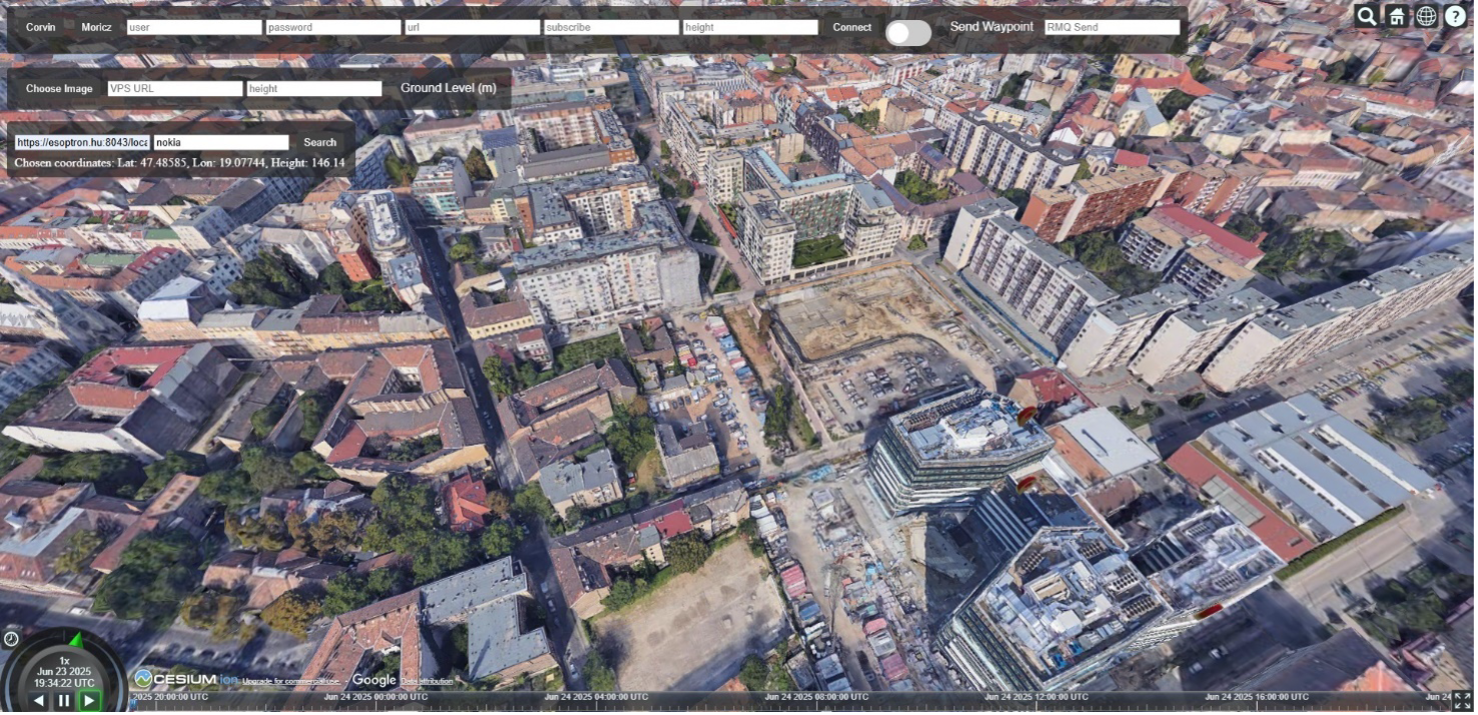
Globe view of POI collection service
In the viewer, we can visualise the results from the Point of Interest (PoI) collection service. To achieve results, we must provide the location of the search, the URL of the service, and the keyword we are looking for. To set the location, click on the ground, and it will set the latitude and longitude as the centre of the search radius.
Globe view of user pose streams
In the viewer, we can visualise the results from the Point of Interest (PoI) collection service. To achieve results, we must provide the location of the search, the URL of the service, and the keyword we are looking for. To set the location, click on the ground, and it will set the latitude and longitude as the centre of the search radius.
Once we click search, it will show every location it found based on our keyword within a 200 meter radius. We settled on this constant because when using spARcl or any WebXR augmented reality application, the content can become crowded if we increase the search radius. This ensures transparency when using the application.
Within the example below we are searching for “restaurant”, “supermarket”, and “Nokia” at the location.

Globe view of user pose streams
In the viewer, the movements of spArcl users are visible. On the spARcl dashboard, users can connect to a rabbitMQ message broker to share and stream their location. In the Cesium viewer, these messages and their positions appear.
In the spARcl dashboard, the user can choose a name and a colour for their avatar, which is displayed above.
In this example, a user is localised using the OpenVPS in front of the Nokia building in Budapest. In the corresponding image, it is visible where the avatars are looking and where they are. If the service is disconnected or the application is closed, the avatar will disappear from the viewer within five seconds.
The viewer can display any position and orientation coming from rabbitMQ if it is connected to the channel and it receives the data in the correct format, which is the following JSON.
It is not only possible to send positions to display in the viewer, but it is also possible to send positions to display in the viewer the other way around. With the creative mode, it is possible to send waypoints to WebXR applications (currently spARcl). In the toolbar, we have to toggle on the Creative Mode switch and set the exchange of the RabbitMQ message broker.
Once this is done, when we click on the ground, a pin will show up both in the viewer and for the user using spARcl. In the video shown below, the pin is highlighted to indicate where it should be placed and where it appears. This discrepancy could occur for two reasons. Firstly, the 3D point cloud used by the VPS is geo-aligned to OpenStreetmap. In the Cesium viewer, we are using Google Maps. This could lead to a couple of meters of error. Secondly, the approximation of the position of the click in the Cesium viewer might not be accurate. The cumulative errors of these can lead to an error in the display shown above.